R and Tableau: A potent visualization integration
May 10, 2018 | Alisha Satish Kumar Pahwa
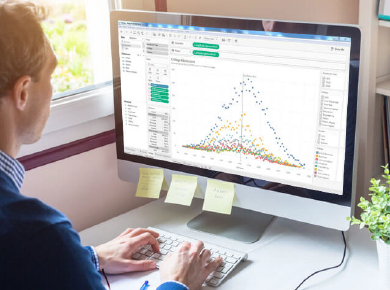
Analyzing large, complex data sets? The combination of programming language R and visualization tool Tableau is a potent one for producing powerful visual analytics tools.
While many organizations use Tableau for data visualization, it takes them a lot of time and effort to derive meaning from Tableau calculations.
In fact, it might even take several clicks just to understand the visualizations. However, since Tableau is already being widely used, organizations may find it too expensive and time-consuming to transition to a completely new technology. Luckily, there’s no need. By simply integrating R capabilities, you can prevent drawbacks caused by this transition.
R is a programming language commonly used for statistical analysis and data graphing, while Tableau is an intuitive visualization tool used by many businesses. In this case, we integrated their capabilities to analyze a large data set related to oil rig failure occurrences and frequency rates across cities in several states. The data included longitudinal and latitudinal information, and we added a clustering algorithm for the cities based on the similarity of failures
How to use R to mine and cleanse data
Usually the data we handle has a lot of unnecessary and redundant information. We use R to mine and cleanse the data and convert it to a form that’s useful for calculations.
Here’s how: First, the data is imported into R using library readxl and read_excel functions. It is then put into a data frame, ready to be mined. Powerful data libraries like rio,dplyr,stringr and htmltools and functions like sub,str_extract are used to perform data mining.
For the preprocessing of the data, we use regular expressions. It’s a way of matching strings, determining similarities and then updating or deleting them, or tuning them to our requirements using string manipulation.
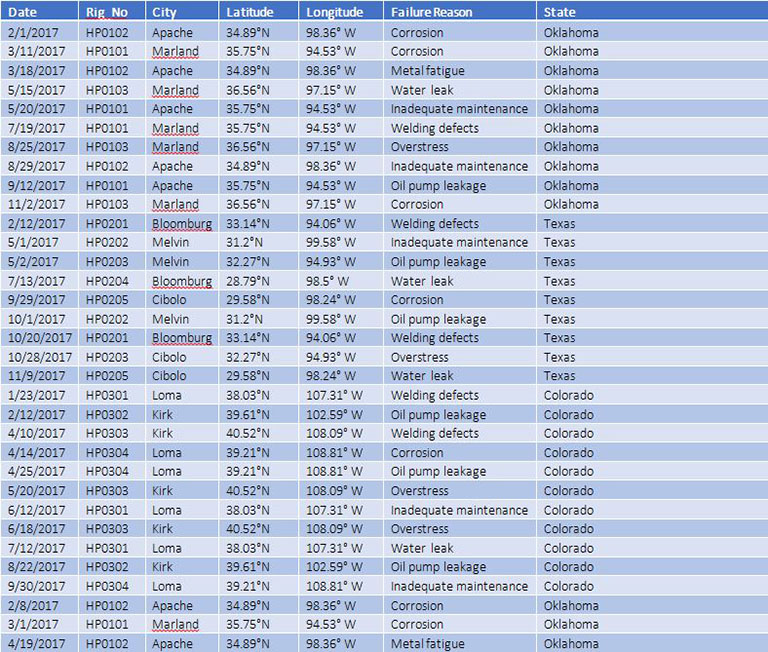
For instance, in the data present here, the word “town” suffixes various city names. The failure reason is in sentences and the cause can be narrowed down to a word.
Data mining examples
Example 1 data: Failed due to corrosion
Function: co<-grep("Corrosion", df$'Faliure Reason',value=TRUE)
co<-as.vector(co)
co <- paste(unlist(co), collapse = "|")
df$'Faliure Reason'<-gsub(co,"Corrosion",df$'Faliure Reason',ignore.case = FALSE))
Final data: Corrosion
Example 2 data: Christine town
Function:df$City<-sub( "town","",df$City,ignore.case = TRUE)
Final data: Christine
In this way, we made many changes to data, and then exported it.
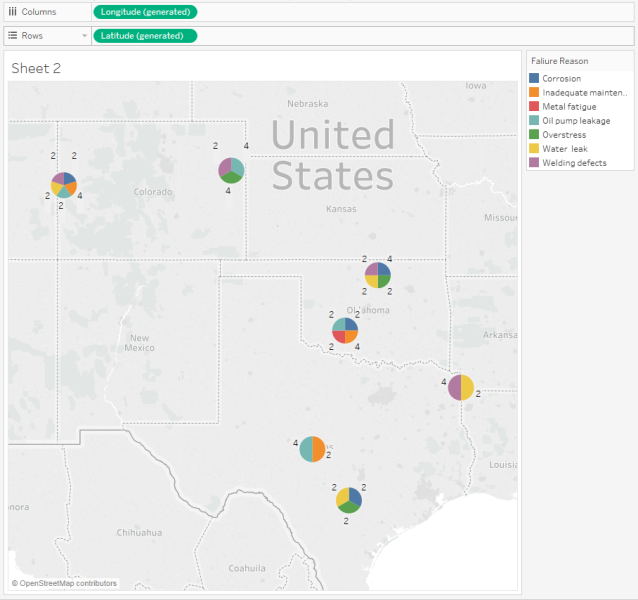
This exported file is then imported to Tableau for visualization. In Tableau, we used pie charts to show the failure in each city with the frequency of each failure represented by a number. The counts are extracted either by using a calculated field, or by directly taking a measure count from the data field.
Let’s now draw our focus on clustering. It’s usually easy to cluster data with numeric values, but it’s almost impossible to accomplish with textual data in Tableau. It’s not intuitive to use the inbuilt clustering feature that Tableau provides for plotting, and there will be many additional associated tasks.
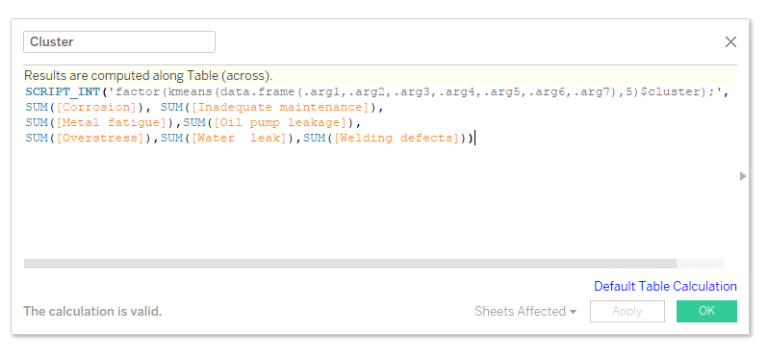
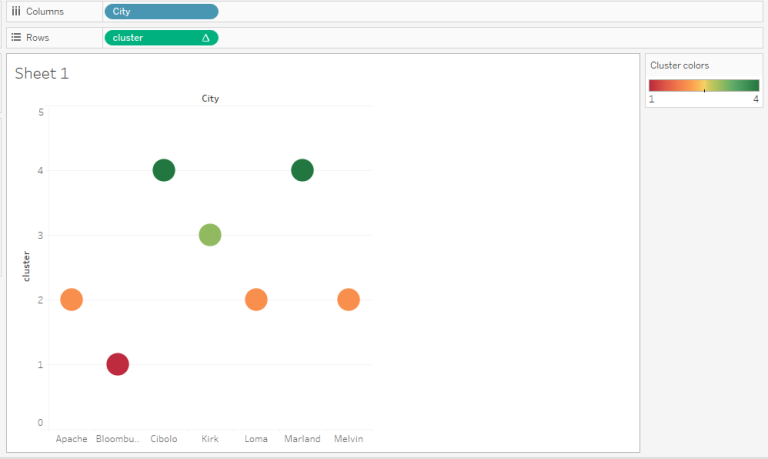
To make it easier, we first converted the data to a frequency matrix in R. This matrix has failure reasons as its columns and city names as its rows. The values populated display the frequency of failure in the respective city. This file is exported to Tableau, where an embedded R script calculates K-means clusters and produces the result in Tableau. The clusters are then visualized with the functionalities Tableau has to offer.
According to DataScience+, “K-means clustering is an unsupervised learning algorithm that tries to cluster data based on their similarity. Unsupervised learning means that there’s no outcome to be predicted, and the algorithm just tries to find patterns in the data.” In k-means clustering, we deliberately need to specify the number of clusters we want the data to be grouped into. The algorithm randomly assigns each observation to a cluster, and finds the centroid of each cluster. Then, the algorithm iterates through two steps:
- Reassigning data points to the cluster whose centroid is closest.
- Calculating a new centroid of each cluster.
How to plot pie charts in Tableau
- Raw data
- R Studio for data mining
- Make changes to data using various packages and functions available in R
- Export the cleaned data to Tableau
- Build meaningful visualizations in Tableau
- Find visualizations with business value
How to plot clusters in Tableau
- Data after mining is obtained to a data frame in R Studio
- R Studio for producing frequency matrix and exporting file
- Embedded R scripts to calculate k-means clusters in Tableau and build visualizations
Example of data before mining
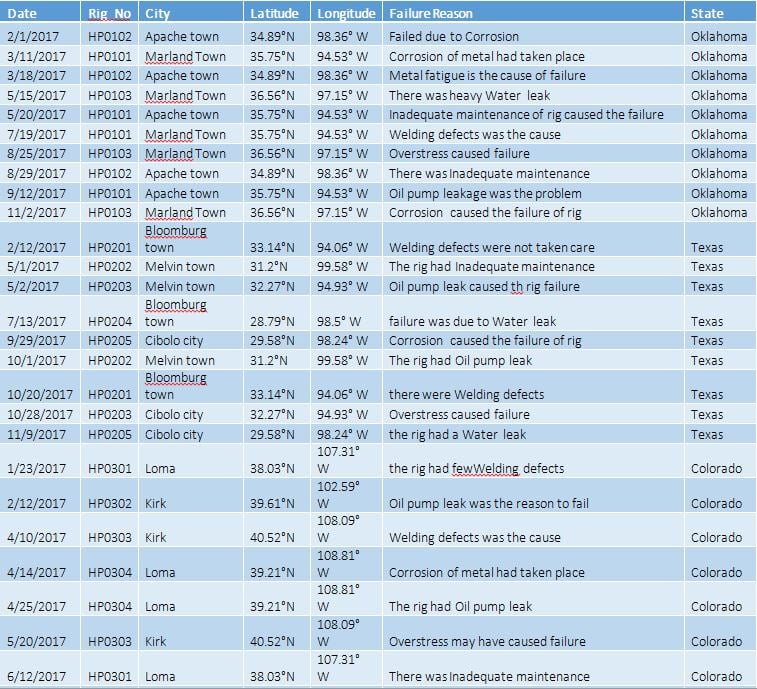
Example of data after mining
Examples of visualizations using Tableau
Pie charts
Clusters
The result of using R and Tableau
Both R and Tableau have drawbacks. If the data mining part is done in Tableau with R embedded script, the output is produced as an aggregate, and then no other calculations can be done on the aggregated column. So, the best approach is to do it in R and import it in Tableau for the visualization. Even in the case of clustering, Tableau is unable to plot the textual data and plots clusters with its inbuilt functionality. R helps it by providing frequency data which is numeric, and then using the embedded R script functionality, k-means clusters are plotted.
This integration of R and Tableau will allow you to create powerful interactive visualizations using statistical analysis to uncover hidden insights. It’s a major step forward from simple BI tools.
Looking for help optimizing and implementing BI and data tools? Learn more about our Analytics Services or contact us.